I use Sentry ↗ to monitor site errors on 84em.com. When something breaks, I get a Slack notification and can dig into the stack trace, affected URLs, and error frequency.
This works fine, but it means context switching: leave what I’m doing, open the dashboard, click through the issue, read the stack trace, figure out what’s happening.
A better workflow
I installed the Sentry MCP ↗ in Claude Code. Now when I get an error notification, I can ask Claude to investigate it directly.
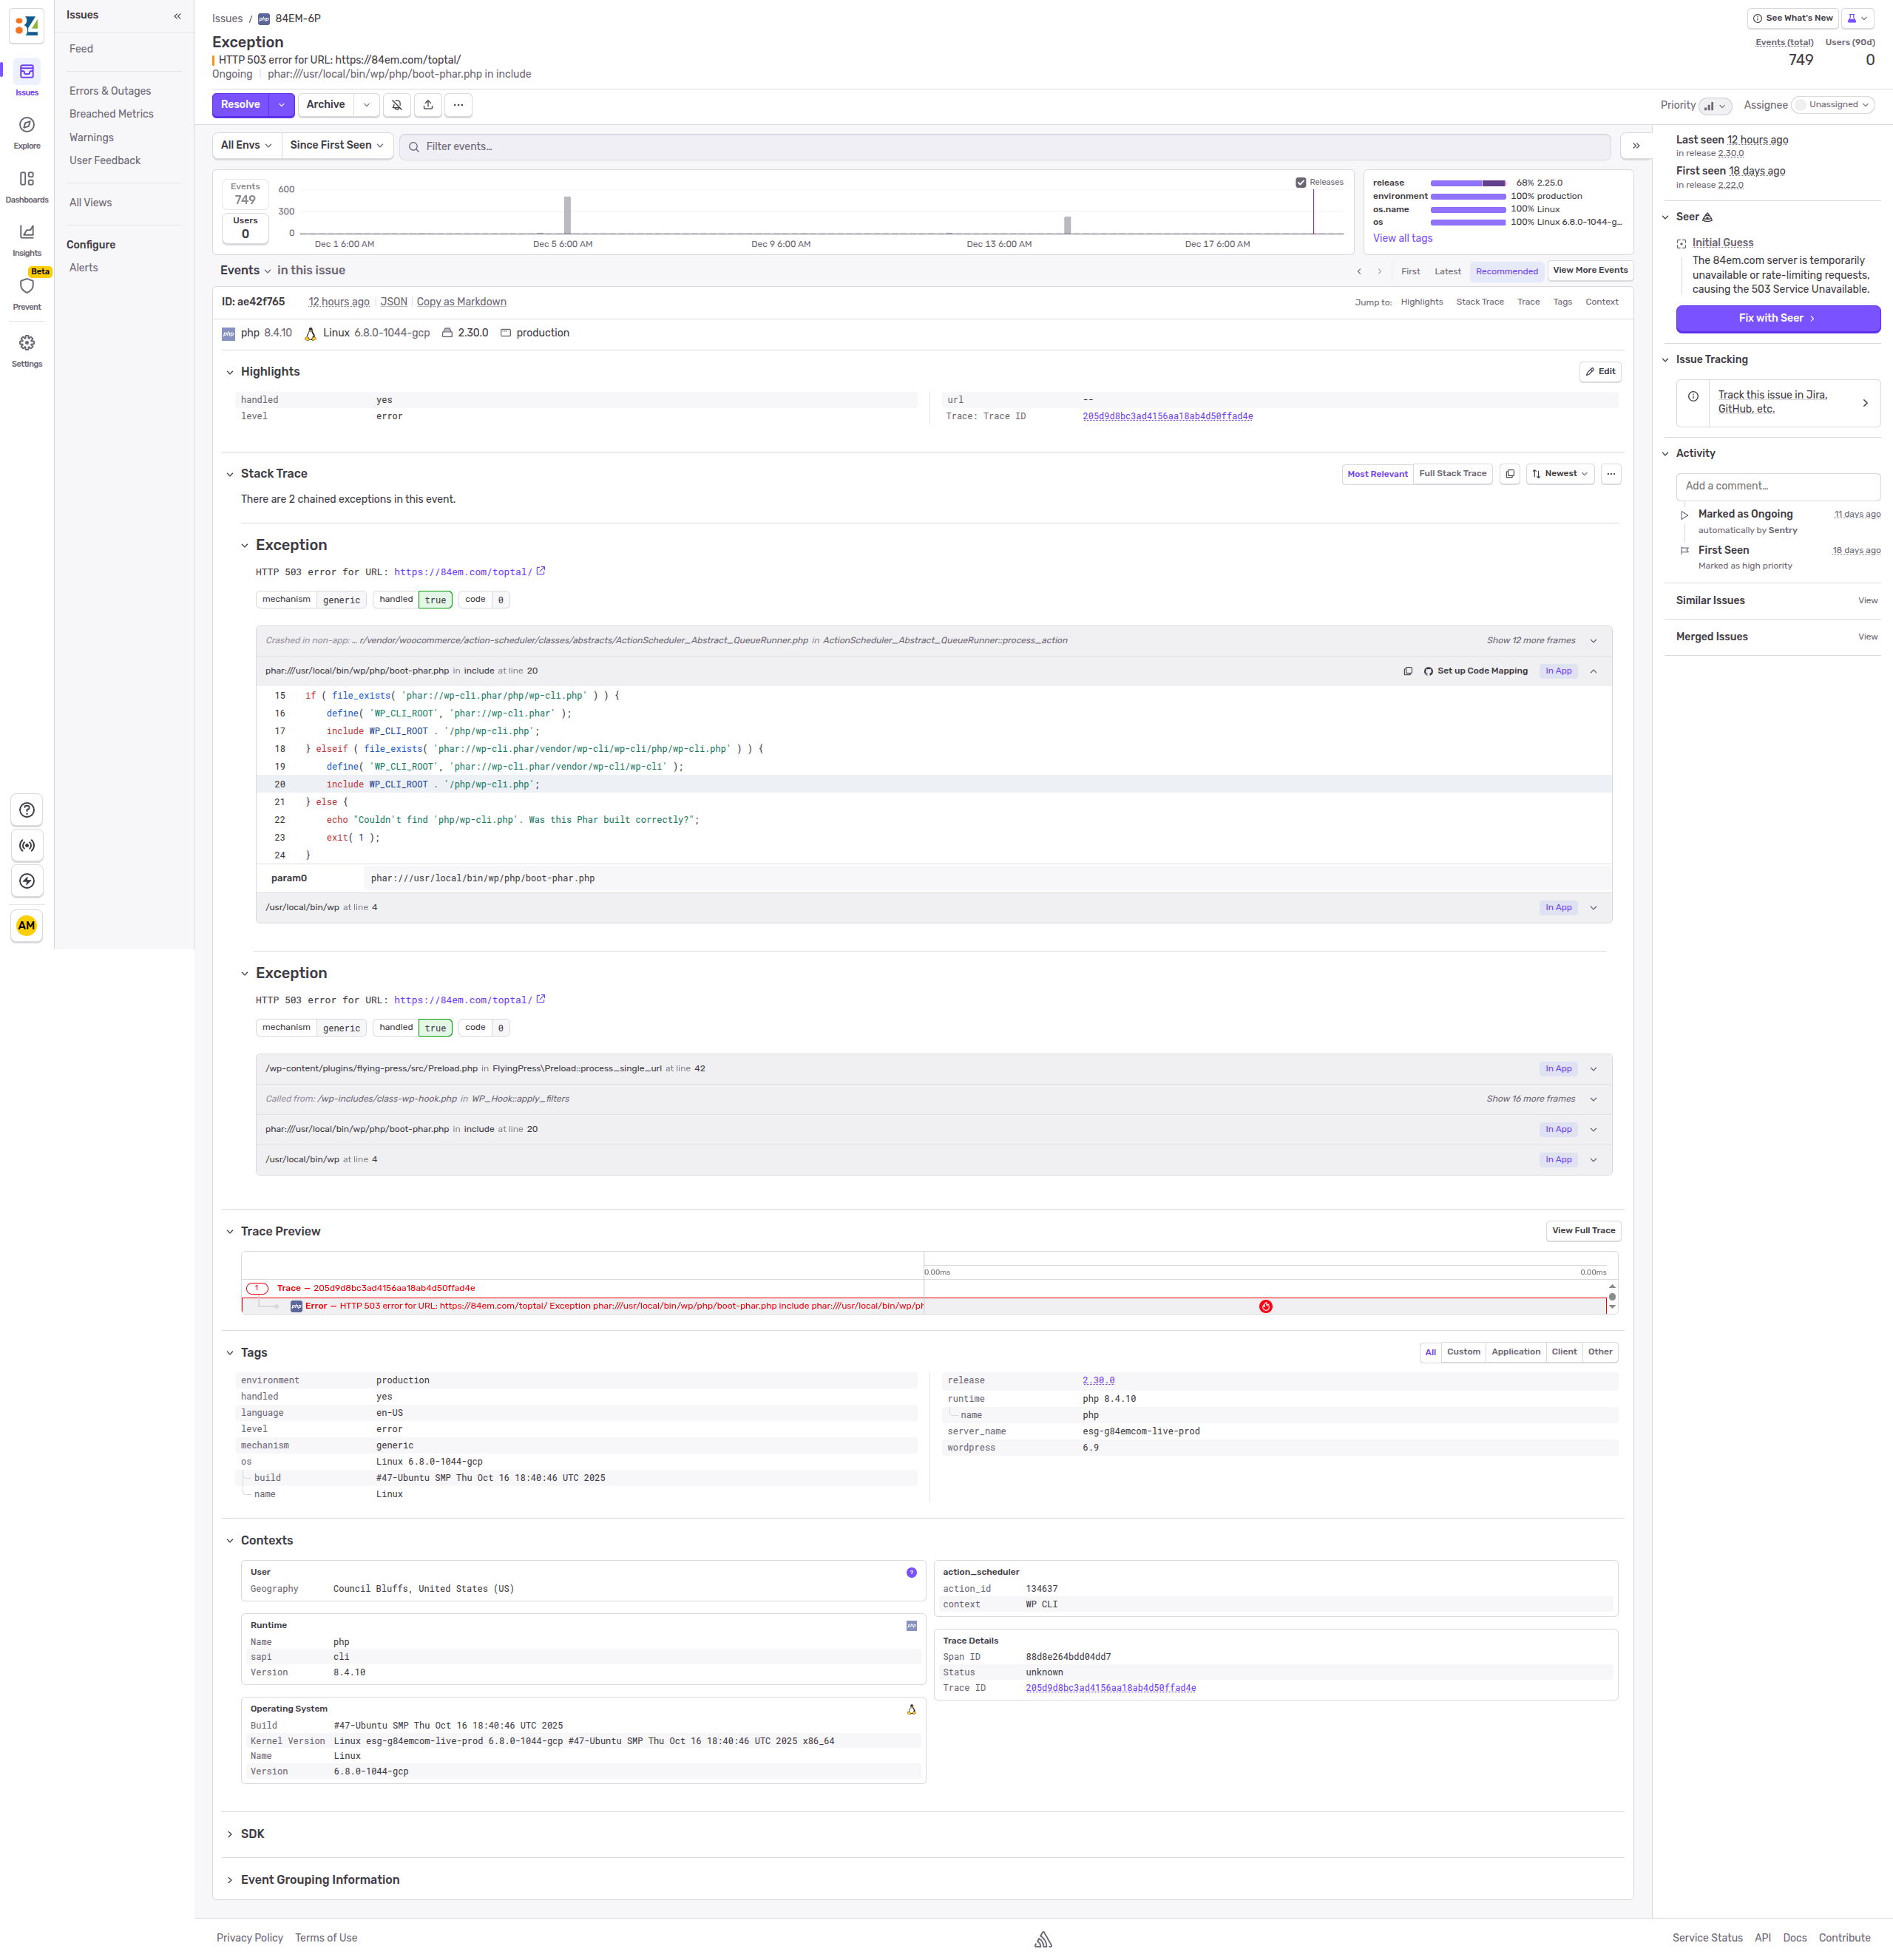
Claude fetches the issue from Sentry, analyzes the stack trace, checks the timeline of occurrences, and produces a full write-up. In this case, it determined that 749 HTTP 500/503 errors were coming from FlyingPress cache preloading during brief server availability issues – not a code bug, just infrastructure noise.
The analysis included:
- Error details – Issue ID, first/last seen dates, total occurrences, affected environment
- Stack trace origin – Which plugin and function threw the exception
- Timeline analysis – When the errors occurred and likely causes
- Root cause – Why this is expected behavior during deployments or high load
- Resolution – Mark as resolved, no code changes needed
- Recommendations – Filter suggestions to reduce noise
The takeaway
I can investigate production errors without ever logging into Sentry. Get a notification, ask Claude to look into it, get a detailed analysis. The MCP handles authentication and API calls behind the scenes.
One less dashboard to check.